Monitoring GPU usage with StackDriver


At work we use Google Cloud Platform to run our machine learning jobs on multiple machines. GCP has a monitoring platform called Stackdriver which can be used to view all kinds of metrics about your VMs. Unfortunately, it doesn't collect any metrics about GPUs, neither usage or memory. The good news is that it is extensible and you can "easily" set up a new kind of metric and monitor it.
To get GPU metrics, we can use the nvidia-smi program, which is installed when you get all the necessary drivers for your graphics card. If you call it simply, it will give you the following output:
> nvidia-smi
+-----------------------------------------------------------------------------+
| NVIDIA-SMI 410.66       Driver Version: 410.66       CUDA Version: 10.0     |
|-------------------------------+----------------------+----------------------+
| GPU  Name        Persistence-M| Bus-Id        Disp.A | Volatile Uncorr. ECC |
| Fan  Temp  Perf  Pwr:Usage/Cap|         Memory-Usage | GPU-Util  Compute M. |
|===============================+======================+======================|
|   0  GeForce GTX 108...  Off  | 00000000:01:00.0  On |                  N/A |
|  0%   43C    P8    17W / 250W |   1309MiB / 11177MiB |      0%      Default |
+-------------------------------+----------------------+----------------------+

+-----------------------------------------------------------------------------+
| Processes:                                                       GPU Memory |
|  GPU       PID   Type   Process name                             Usage      |
|=============================================================================|
|    0       700      G   /usr/lib/Xorg                                 40MiB |
|    0       733      G   /usr/bin/gnome-shell                         110MiB |
|    0       931      G   /usr/lib/Xorg                                371MiB |
|    0      1119      G   /usr/lib/firefox/firefox                       2MiB |
|    0      1279      G   /usr/lib/firefox/firefox                       3MiB |
|    0     23585      G   /usr/lib/firefox/firefox                      24MiB |
+-----------------------------------------------------------------------------+
This is a bit convoluted, hard to parse and has too many details. But, with the right flags, you can get just what you want in CSV format:
> nvidia-smi --query-gpu=utilization.gpu,utilization.memory --format=csv,noheader,nounits
10,35
The first value is the GPU utilization, as a percentage, and the second value is the memory usage of the GPU, also as a percentage.
We are going to write a Python process that open a subprocess to call nvidia-smi once a second and aggregates statistics, on a per minute basis. We have to do this, because we cannot write to Stackdriver metrics more than once a minute, per label (which are a sort of identifier for these time series).
from subprocess import Popen, PIPE
import os
import time
import sys

def compute_stats():
    all_gpu = []
    all_mem = []
    for i in range(10):
        p = Popen(["nvidia-smi","--query-gpu=utilization.gpu,utilization.memory",
                   "--format=csv,noheader,nounits"], stdout=PIPE)
        stdout, stderror = p.communicate()
        output = stdout.decode('UTF-8')
        # Split on line break
        lines = output.split(os.linesep)
        numDevices = len(lines)-1
        gpu = []
        mem = []
        for g in range(numDevices):
            line = lines[g]
            vals = line.split(', ')
            gpu.append(float(vals[0]))
            mem.append(float(vals[1]))

        all_gpu.append(gpu)
        all_mem.append(mem)
        time.sleep(1)

    max_gpu = [max(x[i] for x in all_gpu) for i in range(numDevices)]
    avg_gpu = [sum(x[i] for x in all_gpu)/len(all_gpu) for i in range(numDevices)]
    max_mem = [max(x[i] for x in all_mem) for i in range(numDevices)]
    avg_mem = [sum(x[i] for x in all_mem)/len(all_mem) for i in range(numDevices)]
    return max_gpu, avg_gpu, max_mem, avg_mem
Here we computed both the average and the maximum over a 1 minute interval. This can be changed to other statistics if they are more relevant for your use case.
To write the data to Stackdriver, we have to build up the appropriate protobufs. We will set two labels: one for the zone in which are machines are and one for the instance_id, which we will hack to contain both the name of the machine and the number of the GPU (this is useful in case you attach multiple GPUs to one machine). I hacked the instance_id because Stackdriver kept refusing any API calls with custom labels, even though the docs said it supported them.
from google.cloud import monitoring_v3

client = monitoring_v3.MetricServiceClient()
project = 'myGCPprojectid'
project_name = client.project_path(project)


def write_time_series(name, gpu_nr, value):
    series = monitoring_v3.types.TimeSeries()
    series.metric.type = 'custom.googleapis.com/' + name
    series.resource.type = 'gce_instance'
    series.resource.labels['instance_id'] = sys.argv[1] + "_gpu_" + str(gpu_nr)
    series.resource.labels['zone'] = 'us-central1-f'

    point = series.points.add()
    point.value.double_value = value
    now = time.time()
    point.interval.end_time.seconds = int(now)
    point.interval.end_time.nanos = int(
    (now - point.interval.end_time.seconds) * 10**9)
    client.create_time_series(project_name, [series])
And now, we put everything together. The program must be called with a the name of the instance as a first parameter. If you run it only on GCP, you can use the GCP APIs to get the name of the instance automatically.
if len(sys.argv) < 2:
    print("You need to pass the instance name as first argument")
    sys.exit(1)

try:
    max_gpu, avg_gpu, max_mem, avg_mem = compute_stats()
    for i in range(len(max_gpu)):
        write_time_series('max_gpu_utilization', i, max_gpu[i])
        write_time_series('max_gpu_memory', i, max_mem[i])
        write_time_series('avg_gpu_utilization', i, avg_gpu[i])
        write_time_series('avg_gpu_memory', i, avg_mem[i])
except Exception as e:
    print(e)
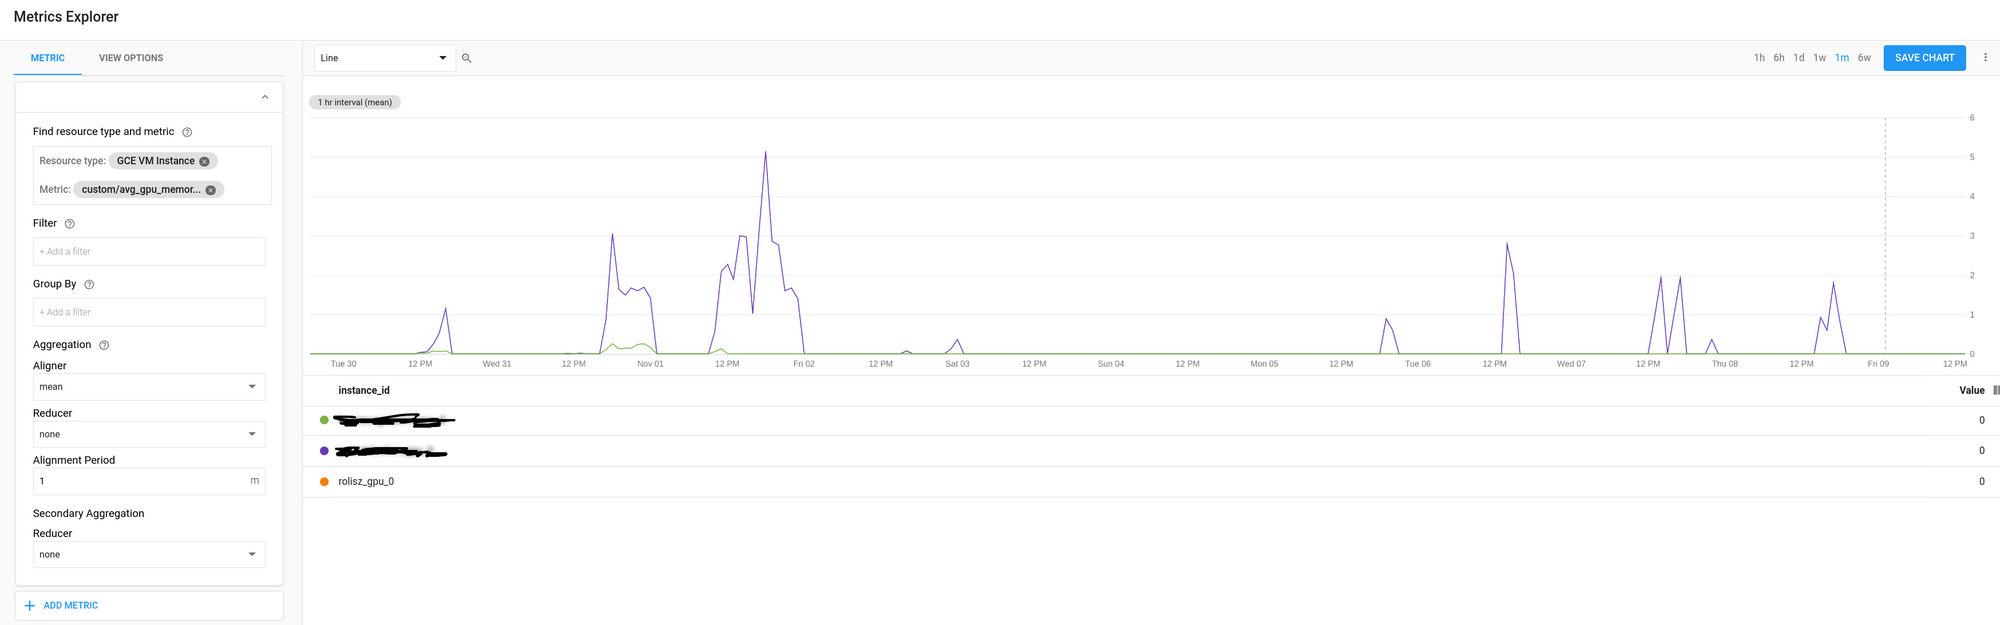
If you save all this code to a file called gpu_monitoring.py and you run this locally, on a machine with an NVidia GPU, after a minute you should start seeing the new metrics in your Stackdriver console associated with your GCP project.
This code can then be called with cron once a minute or it can be changed so that it runs without stopping, posting results once a minute.
* * * * * python /path/to/gpu_monitoring.py instance_name >> /var/log/gpu.log 2>&1Setting up the GCP project and authentication to connect to Stackdriver is left as an exercise to the user. The whole code can be seen in this gist.